
Problem Statement
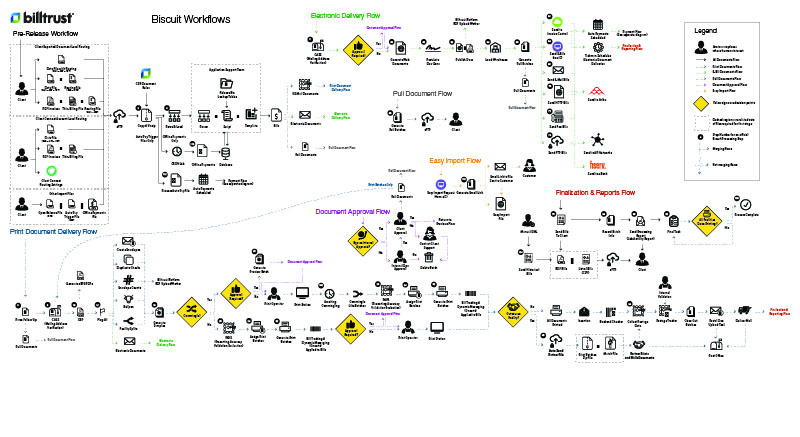
No one person in the organization understood how the legacy products worked, making maintaining them and modifying them an exercise in fear mitigation. Onboarding new talent was nearly impossible. We needed a diagram of the entire workflow illustrated with all of the glorious details one must be aware of when discussing any product's alterations. We needed these for several product lines so that Product Owners could make informed decisions.
Research Performed
I had to perform dozens of interviews with Subject Matter Experts (SMEs) across different specializations to uncover precisely the details of the product's workflows in its logic. Several low-level developers had to consult the direct code to provide answers to my questions. I conducted interviews across various Business Analysts, Implementations, Developers, System Architects, Print Operators, Customer Support, Product, and even Executives to uncover all of the details this diagram must contain. I used Adobe Illustrator and TheNounProject to gather symbolic icons for each step of the workflow so that it was incredibly visual and easy to understand at a glance. The workflow ended up being six sub workflows interconnected at various points with seven decision trees with 125 steps. Ten design iterations were required to get it correct.
I performed a similar process as before with dozens of interviews. This activity yielded a final payment flow diagram after six iterations with 106 steps and five sub-flows.
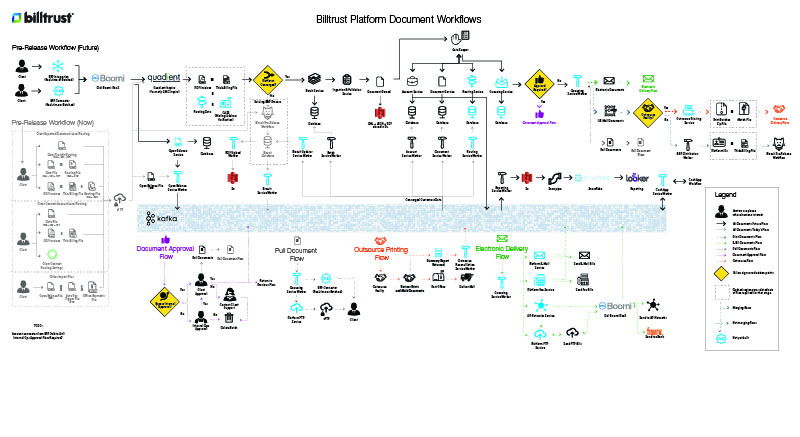
This design was unique in that it was a direct collaboration with systems architects to communicate the desired architecture that would serve as a diagram to integrate multiple products on the same platform. Parts of this diagram were future thinking in nature identified by their blue icons. This diagram helped Product Owners strategically decide what avenues to pursue to proceed with integration efforts. This diagram went through 6 various iterations and 177 steps with seven sub-flows
Legacy Invoicing
Payment Flow
Platform Flow
Outcomes
- Several large-scale posters were printed and distributed to all facilities to encourage collaboration and promote architectural discussions.
- These diagrams were leveraged heavily by System Architects, Product Owners, and Development Leads for the migrations and convergence efforts between products.
- These diagrams continue to be used to onboard new employees during training.